How to Use Donation Segmentation
- Click the ‘Select period’ button on the top‑right corner of the widget to filter the data.
- Select the calendar year you would like to analyse.
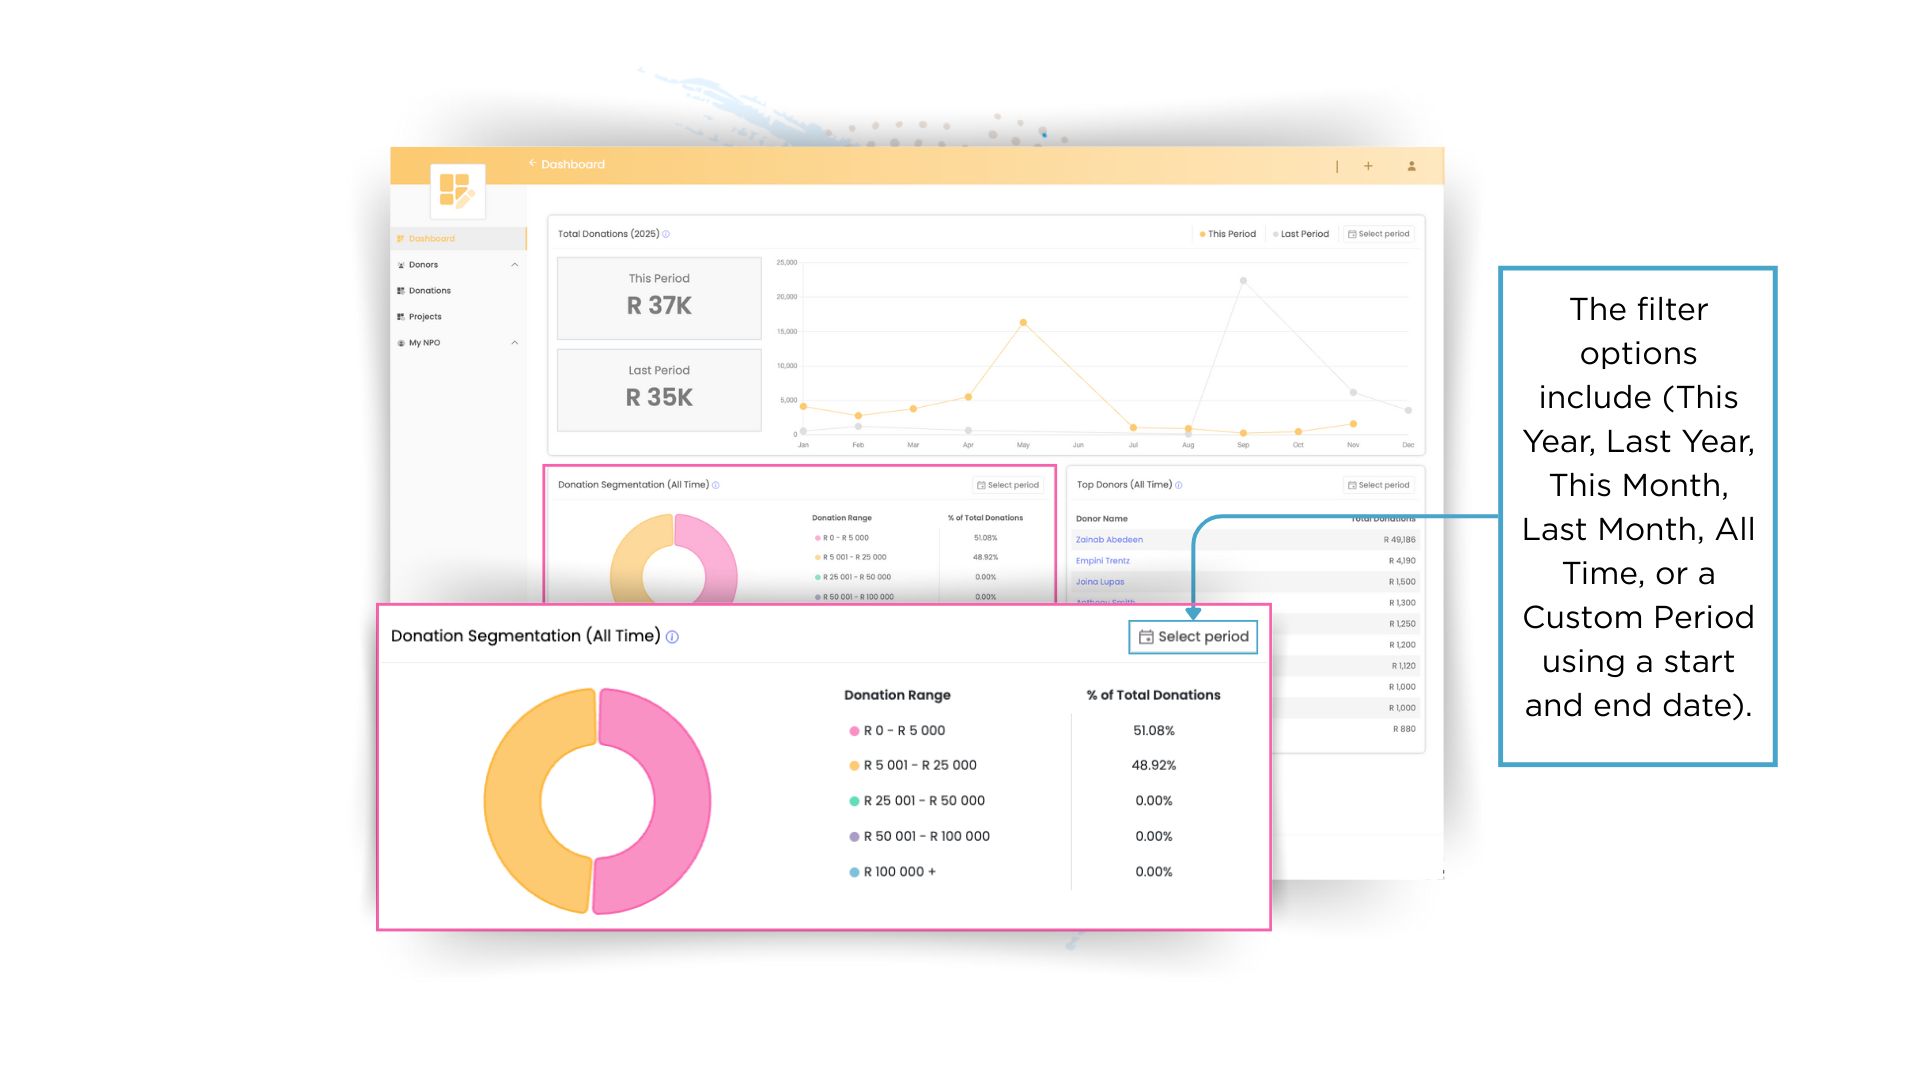
- Once a period is selected, the chart and percentages refresh to reflect the donations segmentation in that timeframe.
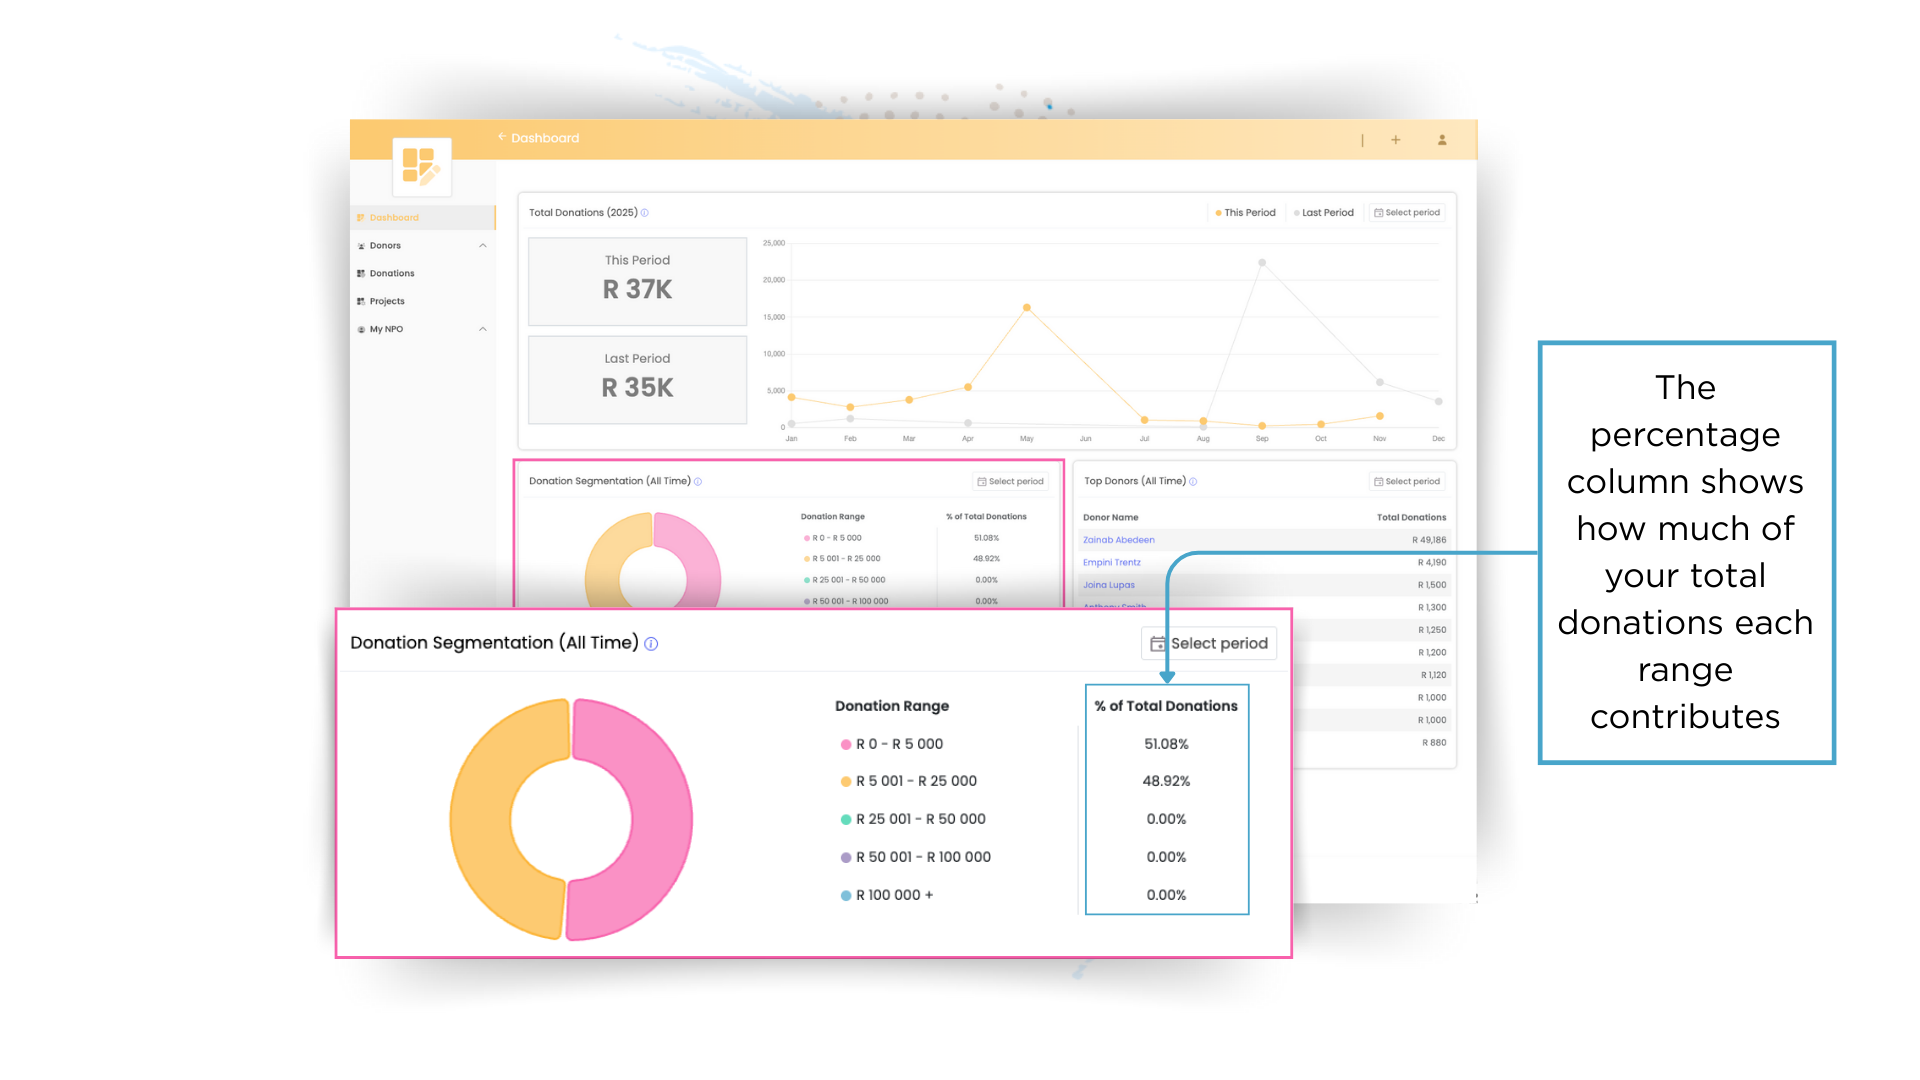
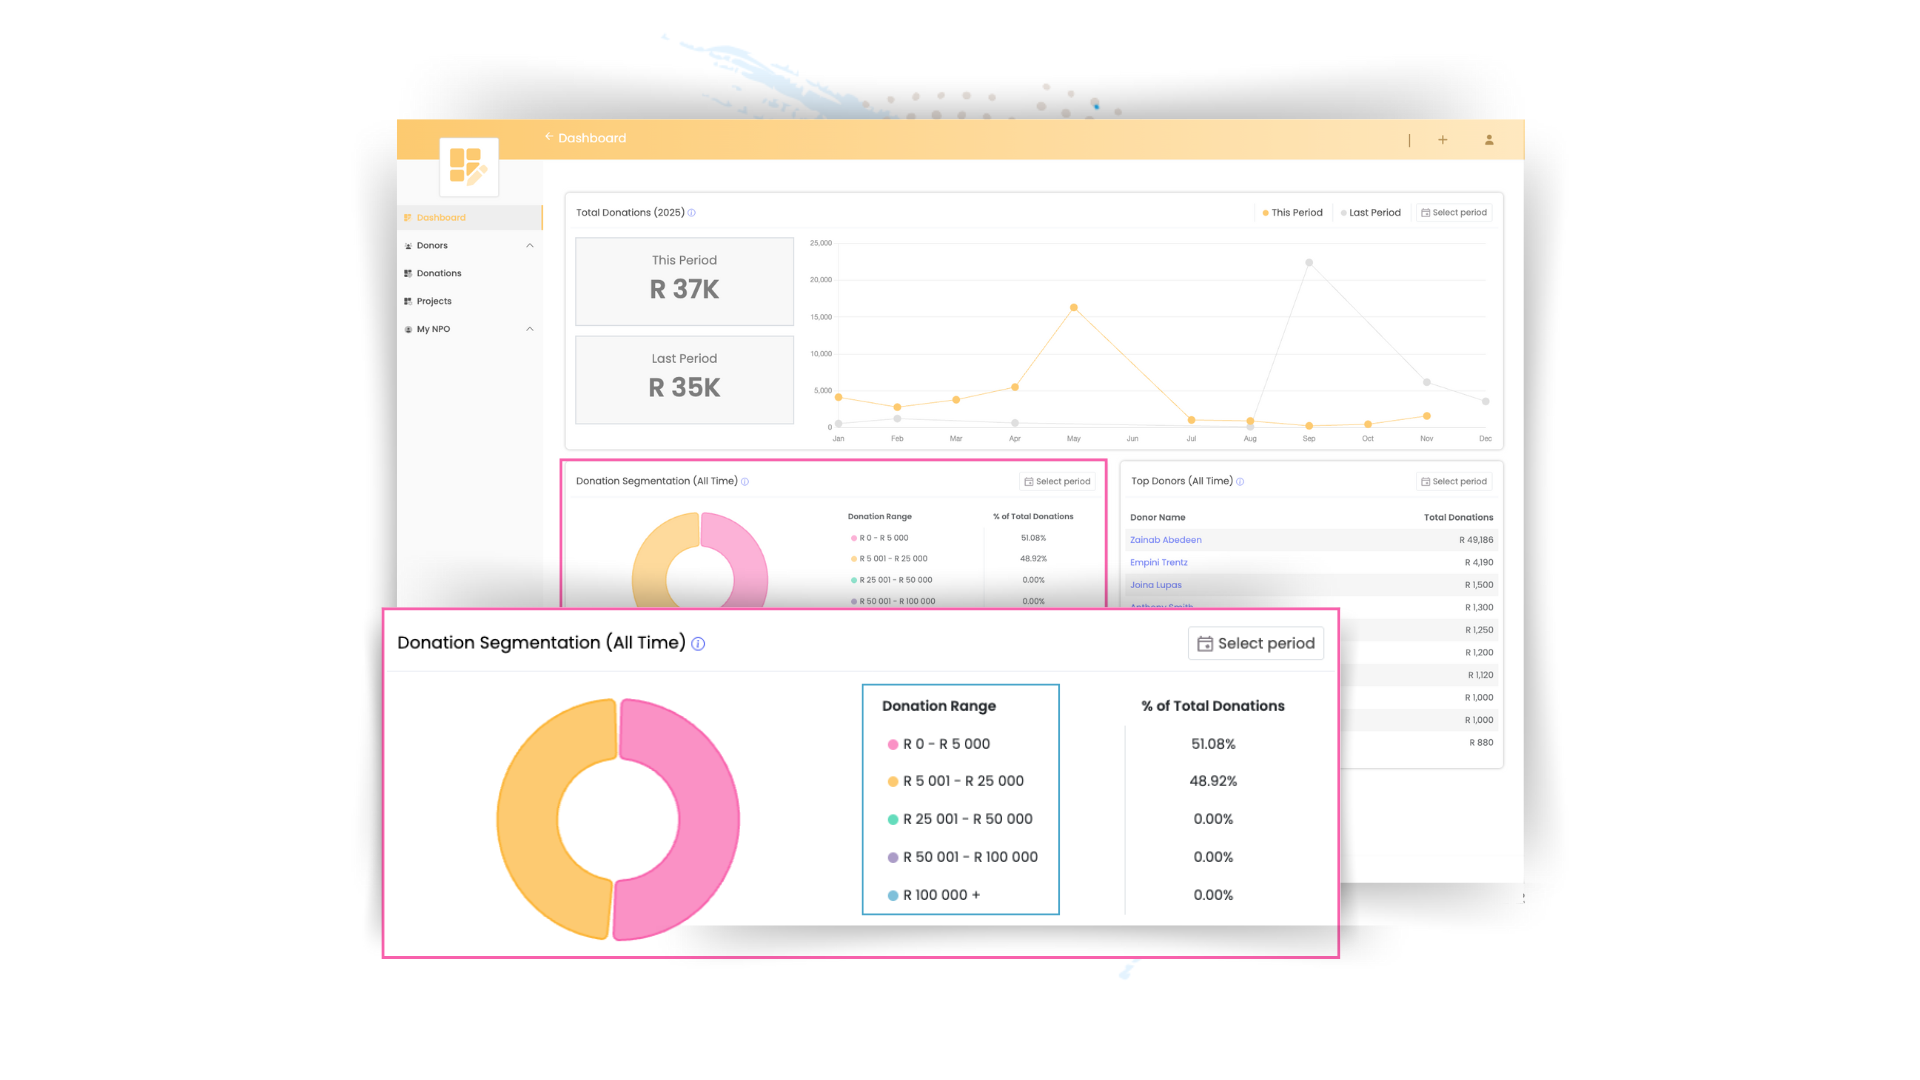
- Each colour segment corresponds to a donation range (e.g., R0 – R5 000, R5 001 – R25 000, and so on).
Did this answer your question?
Thanks for the feedback
There was a problem submitting your feedback. Please try again later.
No results found

